Elderly care 2.0: empowering services by data science
In the previous posts, we talked about why elderly care becomes a top priority in every society and how AI and data science can be leveraged to help create solutions to many challenges. To provide personalized care for individuals, remote monitoring is necessary, but naive use of such solutions can cause more harm than good. Federated Learning is one way to address this challenge. This post is about how monitoring can be used together with other information sources for better support at the individual and community levels.
To start with, let us admit we are nerds: we all love stats (hope, you do, too!). And in health care, there are tons of stats! It is great, but statistics are useful only when the context is given. Context is defined in space and time, so we need measurements across regions that can periodically update our knowledge (models) of whatever we care for. It was not so long ago that everyone was watching COVID-19 epidemics infographics and statistics that gave us minute information across the globe (like https://www.worldometers.info/coronavirus/ or https://ourworldindata.org/coronavirus or https://coronavirus.jhu.edu/map.html). It became obvious to everyone that proper use of modern digital tools (hardware, communication, software) can be vital. In emergency situations, we throw in everything we have to get answers and make quick decisions. With dense observations and the right modeling it is possible to see who is at greater risk, where should medical aid be deployed first, how to reorganize logistics, etc.
Thankfully, emergencies are not permanent. But we did learn a lot about efficient information gathering and modeling at a social scale! And this fresh knowledge is what is needed when we think about the support of large communities: be it kids in remote villages, elderly people living at home, or the general population in large areas without proper infrastructure. These scenarios are quite different, yet similar tools and services can support them. In turn, what we learn in one field, may become handy in another one!
Here is a very interesting report on how digital health tools could empower the existing health systems in different regions of Africa [1]. While regions vary regarding infrastructure, level of financial support, or the extension of the health care systems, they all have to face some common challenges like vast areas without safe transportation options and cultural and language differences. According to the McKinsey report “digital health tools are technology-enabled products and services for patients, healthcare workers, communities, pharma, and biotech companies, public-health leaders, regulators, and payers.” They divided the various data-driven and AI solutions into 6 categories:
- virtual interactions: remote consultations, emergency handling, mental support
- paperless data: health information exchange, cloud-based prescribing
- patient self-care: services that require the active participation of the clients
- patient self-service; appointments, etc
- decision intelligence systems: statistical modeling, decision support, etc
- workflow automation: logistics and resource optimization, device management
According to McKinsey’s estimates, efficiency gain or savings by introducing various digital health tools could be somewhere between 2 billion and 11 billion dollars in South Africa only by 2030 (6 to 15 percent of total projected healthcare spending)! The individual contribution of the most relevant tools and services are shown in the next table:
|
Digital health tools |
Conservative scenario |
Optimistic scenario |
 |
||
|
Share of total savings from digital adoption in South Africa, 2030, % [1] |
||
Clearly, quite a few tools and services are a crucial part of the healthcare system or related to activities in medical centers (like genetic testing, performance dashboards or hospital logistics). But many are (could be) relevant to the elderly care, too! While the infrastructure (public transportation, road systems, communication networks, etc) is significantly better in Poland or Hungary, in reality, access to these infrastructures is quite limited to the elderly. So there is a very strong similarity between the two scenarios. Perhaps it seems like a big leap in logic, but we can assume the relative contribution of the listed services and tools would be roughly similar when properly used in elderly care. Now let us dig a bit deeper and pick the ones with the largest potential.
Virtual interactions
Well, it is no surprise that virtual interactions between patients and caregivers can significantly increase efficiency, especially when resources are scarce or when mobility is limited. That is why we have a deep interest in large-scale monitoring and virtual assisting solutions (see our previous posts!). Even under the more conservative scenario, these services would give about 39% of the overall efficiency gain.
Information exchange (“Paperless data”)
What is surprising, though, is that the least complicated of all the listed tools may have the largest impact! Basically, it is about having fully digitized electronic health (or status) records that can be searched, compared against, or integrated with other information sources. Again, under the more conservative scenario, this group of services would yield almost 24% of the overall efficiency gain.
Considering the fact that creating and maintaining large datasets are way cheaper than any of the other methods in the table, this contribution is huge! It is actually so huge that everyone should start jumping now! Well, maybe not. While technically, integration of various data sources can be done, there are many obstacles that make this task a real challenge.
Probably the single most important issue is of legal nature. Patient records, monitoring data or any other personal information collected fall under a “special category” as defined by the European Union’s General Data Protection Regulation (GDPR) or “sensitive data” as defined by the Chinese Personal Information Protection Law (PIPL). In the USA California’s Consumer Privacy Act (CCPA) has become the national standard. On the surface these laws are similar, but there are significant differences that make data-driven healthcare and elderly care complicated. Of the many differences let us just highlight two outstanding features. Compared to PIPL[3], GDPR gives a very detailed list of data types and use cases regarding “special category”, but its scope is narrower. Compared to CCPA [2], GDPR requires explicit consent, which can hinder the entire information-gathering process impossible in some cases.
Clearly, some monitoring data cannot be anonymized as we need to know exactly what the patient is in need of and where she needs help. Differential privacy, however, makes it possible to separate general information that can be safely anonymized and is not considered sensitive [4] anymore.
Beyond Paperless data
Of course, all these numbers in the quoted study are just rough estimates as there are so many unknowns. But they do indicate how important is to invest in the future and start the transformations. And clearly, once these tools are up and running their joint impact becomes ever larger.
But why stop here? The listed services and tools are directly related to healthcare data or services. Once a secure link to the digital world is established, several new opportunities will arise by incorporating additional information sources.
Here we list some ideas on how additional information sources could be used, but we believe that the possibilities are endless.
- Dynamic comprehensive geriatric assessment (CGA)
- Weather forecast and pollen maps
- Digital elevation maps (DEM)
- Contact-distance maps
Dynamic comprehensive geriatric assessment (CGA)
According to [10] CGA “ is defined as a multidisciplinary diagnostic and treatment process that identifies medical, psychosocial, and functional limitations of a frail older person in order to develop a coordinated plan to maximize overall health with aging”.
To put it simply it is about understanding the individual’s needs and limitations and defining the best strategy for maintaining her well-being [5,6]. However, needs and limitations can change quickly due to the deterioration of the health status or some unexpected changes in the surrounding infrastructure. What if the nearest grocery has gone bankrupt? What if the next bus line is closed due to construction work? This kind of information is dynamic by nature and its use and integration with health status data are not straightforward. Yet it would make elderly care more proactive and efficient!
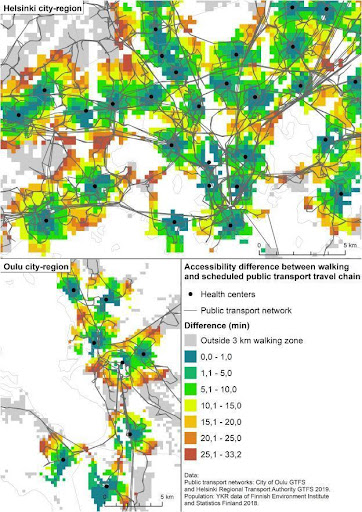
Naturally, social care systems have resource limitations so they must consider the needs of all the persons who need support. Similar to primary health care accessibility analysis (like [8] ), geographical modeling of the accessibility of care centers or other services by the elderly community could also be extremely informative. Maps like the following could be dynamically created and updated for each type of service (health care, pharmacies, community centers, parks, etc):
 |
|
Access by public transport vs walk time difference for two large cities in Finnland. Source [8] |
By periodically updating these accessibility maps, we could spot regions that suddenly become less accessible indicating that proper measures must be taken.
Weather forecast and pollen maps
In addition to changes in the infrastructure, natural changes, like weather can also cause severe problems for many. Extreme temperatures unfortunately become more frequent and there are several early warning systems in place. But abrupt changes like strong wind or rain fall are hard to prevent. Their impact, however, depend on the density of older persons in a given region and so proper responses can be modeled and defined in advance.
Talking about wind. Air pollution (smog and pollens) hit elderly people with deteriorated health condition stronger. Services like https://www.breezometer.com/air-quality-map/ give detailed information about air quality for more than 60 countries. Many countries have public service showing the current situation, like the national pollen map in the US: https://www.pollen.com/map
Wind forecast and pollen maps combined could also be used to inform people about what to expect and how to minimize risk. What is needed here? Health information exchange system, monitoring data about current and expected location of the persons and dynamic weather maps.
Digital elevation maps (DEM)
When monitoring at scale, we can quickly collect statistics that give us an overall view on the current status of the community. However, geographic information can add a lot to our understanding. For example, by monitoring walking speed and time spent we may spot someone who moves significantly less than the average. But what if that person lives in a mountain village where moving requires more amount of energy? This information can be taken into account by using elevation maps. [11]
Contact-distance maps
We already talked about how elderly care will become our common responsibility. Families together with community resources can give the right support. Whenever it is possible, social workers collect information about primary contacts. Having family members around can make services much more efficient and provide better emotional support. But it is also important to know how far the primary contacts live. Contact-distance maps could be of help when deciding about asking for help vs providing social care support in case of an emergency or, for instance, a planned visit to the doctor.
We believe that this list will grow in the future. What is needed is your imagination and our technical expertise to make all these possible.
References
[2] https://www.cookieyes.com/blog/ccpa-vs-gdpr/
[4] https://www.gdprsummary.com/anonymization-and-gdpr/
[6] https://core.ac.uk/download/pdf/236433397.pdf
[7] https://www.ncbi.nlm.nih.gov/pmc/articles/PMC6068710/
[8] https://www.sciencedirect.com/science/article/pii/S0143622821001995
[9] https://www.ncbi.nlm.nih.gov/pmc/articles/PMC6852049/
[10] https://www.uptodate.com/contents/comprehensive-geriatric-assessment
[11] https://omdena.com/blog/topographical-maps-deep-learning/


